- Super User
- قاعدة البيانات المالية
الخطة الاستراتيجية لمركز البحوث والنشر والاستشارات للعام 2017-2021م
غير منشورتقييم المستخدم: 0 / 5


Phase (1)
The Banks database contains data from Bank of Sudan aggregate balance sheet, income statement numbers from 2010 to 2014 of Sudanese Banks so the data was entered using the same code used by the Bank of Sudan for their aggregate report of Sudanese banks. Then a computing program was used in order to compute financial ratio which represent standard financial ratio which act as a bench mark for Sudanese banks and can use to compare with their own ratios. The standard financial ratios computedthen generated from the computer in form Diagrams.
Financial ratios
The classification chosen was the priori approach which is a simple grouping system that can be used to provide some structure to a set of financial ratios. This approach is used in most accounting text books. This bank data base use five main categories:
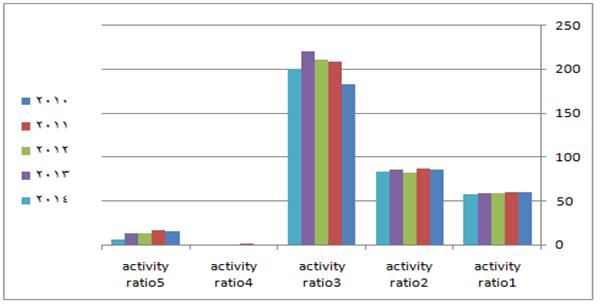
1- Activity ratios:
This ratios measure how efficiently and effectively the bank management manage the assets of the bank. There five ratios:
Ratio 1 = Asset turnover= total deposits/Total assets of the banks
Ratio 2 = Account receivable turnover=Total Finance granted by the bank/ total deposits
Ratio 3 =Total finance to Investment deposit= Total Finance granted by the bank/Investment deposits
Ratio 4 =Securities investment to Total Finance granted by the bank= Invest in securities/ Total Finance granted by the bank
Ratio 5= return on equity= Stockholder equity/ total liabilities
The following table shows the activity ratios from 2010 until 2014
| Asset turnover | Account receivable turnover | Total finance to Investment deposit | Securities investment to Total Finance | return on equity | |
| 2010 | 59.63854502 | 85.24220765 | 181.7954946 | 0.088752014 | 14.91757205 |
| 2011 | 59.73763741 | 85.9503822 | 207.4149312 | 0.710817035 | 15.34317614 |
| 2012 | 58.09575677 | 81.9636525 | 209.7435074 | 0.00785029 | 12.44923693 |
| 2013 | 58.29605273 | 84.82965662 | 219.1934993 | 0.02175099 | 12.96877467 |
| 2014 | 57.83638221 | 82.56758929 | 199.6356499 | 0.019114939 | 5.568911155 |
The chart below shows the comparison of the activity ratios from 2010 until 2014
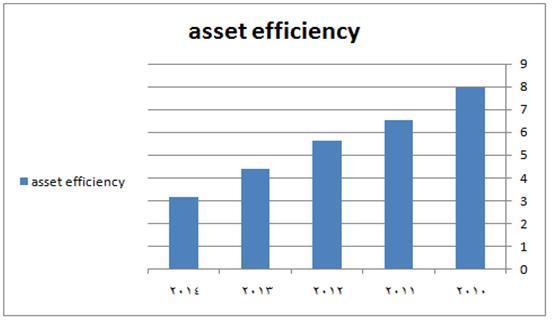
2- Efficiency ratios
These ratios measure the quality bank assets and how efficiently are used only one ratio was calculate this category is under study because it overlap with other categories or cannot be calculated because of the lack of data. There is only one ratio
Ratio = other debit\total assets
The following table shows the asset efficiency ratios from 2010 until 2014
| other debit\total assets | |
| 2010 | 7.956561018 |
| 2011 | 6.529716722 |
| 2012 | 5.647410081 |
| 2013 | 4.412849259 |
| 2014 | 3.159025096 |
The chart below shows the comparison of the asset efficiency ratios from 2010 until 2014
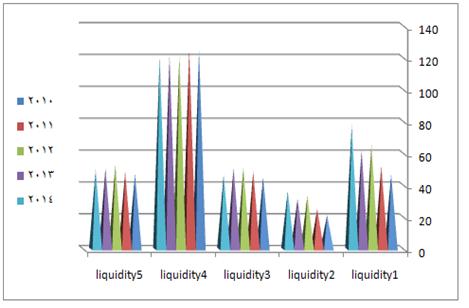
3- Liquidity ratios
Liquidity ratios measure the ability of bank to meet its short-term obligations toward deposit holder and other short term liabilities. The ability to pay current deposit withdrawals which is of concern to anyone who interacts with banks. The liquidity ratios look at aspects of the bank's assets and their relationship to current liabilities.
There 5 ratios
Ratio 1 Cash to current deposit = cash/Total current deposit
Ratio 2 cash to deposit = cash/ total deposit
Ratio 3 = Current deposit to total deposit= = Current deposit / total deposit
Ratio 4 Quick ratio = Cash+ marketable securities+ notes receivable+ Bank of Sudan account/Total current liabilities
Ratio 5 Current ratio = current assets /current liabilities
The following table shows the liquidity ratios from 2010 until 2014
| Cash to current deposit | cash to deposit | Current deposit to total deposit | Quick ratio | Current ratio | |
| 2010 | 46.94381 | 21.27098 | 45.31158 | 124.9144 | 47.16322 |
| 2011 | 52.15453 | 25.38991 | 48.68208 | 125.08 | 48.60829 |
| 2012 | 65.73972 | 33.55075 | 51.03573 | 121.7633 | 53.10048 |
| 2013 | 62.01966 | 31.59487 | 50.94331 | 121.4979 | 50.73784 |
| 2014 | 77.80413 | 36.39237 | 46.77434 | 120.9696 | 49.79154 |
The chart below shows the comparison of the liquidity ratios from 2010 until 2014
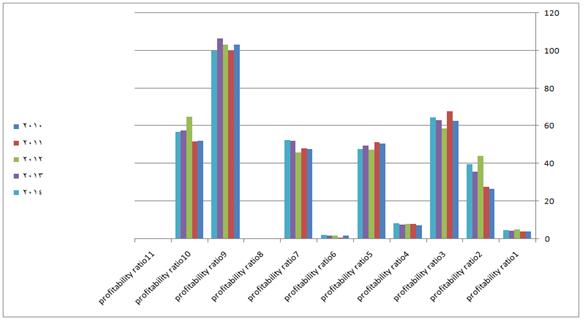
4- Profitability ratios
Profitability ratios are designed to evaluate the bank's ability to generate earnings.
Analysis of profit is of vital concern to stockholders since they derive revenue in the form of Dividends. Profits are also important to creditors because profits are one source of funds for debt coverage.. Furthermore Management uses profit as a performance measurement There are 11 ratios
Ratio 1 Return on assets= Income after tax /Average of total assets
Ratio 2 Return on equity=Income after tax/ average stockholder equity
Ratio 3 Finance income=Income from finance/total income
Ratio 4 Basic earning power= Income before Tax and Zakat/Total assets
Ratio 5Other debit to total assets = Other debit / total assets
Ratio 6 Provision for Finance risk = Provision for doubtful debit/net income
Ratio 7Expenses to revenue = Total expenses / total revenue
| Return on assets | Return on equity | Finance income | Basic earning power | Other debit to total assets | |
| 2010 | 3.847828968 | 26.49832353 | 62.57055045 | 7.386874728 | 50.83721239 |
| 2011 | 4.159434315 | 27.82362318 | 67.92286932 | 8.006064281 | 51.34472767 |
| 2012 | 5.2970224 | 44.08315349 | 58.62340287 | 8.144682445 | 47.55641559 |
| 2013 | 4.485923005 | 35.64690666 | 63.00243638 | 7.793852155 | 49.45234135 |
| 2014 | 4.692699388 | 39.72154949 | 64.56825799 | 8.24460533 | 47.75410652 |
Ratio 8 Efficiency indicator = Operating expenses/ Operating revenue
Ratio 9 Gross profit margin= Net operating profit/ Bank’s sharefrom finance and investment
Ratio 10Net profit margin = Net operating profit / total bank income
Ratio 11 Cost ratio = Total expenses /total revenues
The following table shows the profitability ratios from 2010 until 2014
| Provision for Finance risk | Expenses to revenue | Efficiency indicator | Gross profit margin | Net profit margin | Cost ratio |
| 1.887715876 | 47.90991983 | 0.265393083 | 103.3248541 | 52.09008017 | 0.015829304 |
| 0.632313149 | 48.04645368 | 0 | 100 | 51.95354632 | 0.017211949 |
| 1.968708003 | 46.11685398 | 0.294006595 | 103.1288861 | 65.03657369 | 0.02140813 |
| 1.737731864 | 52.2037412 | 0.286348075 | 106.4690762 | 57.55719913 | 0.018233438 |
| 2.019785941 | 52.4489561 | 0 | 100 | 56.91842363 | 0.012786354 |
The chart below shows the comparison of the profitability ratios from 2010 until 2014

5- Debit ratios.
Viability and capital structure ratios measure a company’s ability to meet its obligations and how much of the company’s assets are financed with debt. They reveal the equity cushion that is available to absorb any losses that may occur. There are 6 ratios
Ratio 1 Debit to asset = Total liability/Total liabilities and stock holder equity
Ratio 2 Equity asset ratio = =Stockholder equity/Total liabilities and stock holder equity
Ratio 3 Debit to equity ratio =Liabilities/ Stockholder equity
Ratio 4 Equity to fixed assets= Stockholder equity/Fixed assets
Ratio 5 Liabilities to total assets= liabilities/total assets
Ratio 6 Equity of deposit= Stock holder equity/Total deposits
The following table shows the debt ratios from 2010 until 2014
| Debit to asset | Equity asset ratio | Debit to equity ratio | Equity to fixed assets | Liabilities to total assets | Equity of deposit | |
| 2010 | 85.07689706 | 17.5407231 | 570.1019247 | 334.0826945 | 2.850924449 | 24.34839406 |
| 2011 | 84.6501292 | 18.13331054 | 551.4712814 | 314.268606 | 3.06E-08 | 25.0249112 |
| 2012 | 87.57974379 | 14.18165397 | 705.1363702 | 283.2374444 | 2.39E-08 | 20.68305763 |
| 2013 | 87.09955112 | 14.81115426 | 675.1668253 | 248.6042413 | 2.63E-08 | 21.58692671 |
| 2014 | 94.45340193 | 5.872311591 | 1702.906912 | 229.4904444 | 7.29E-08 | 20.4265694 |
The chart below shows the comparison of the profitability ratios from 2010 until 2014
تقييم المستخدم: 0 / 5
السودان - الخرطوم - شارع الجامعة - العنوان البريدي ص.ب 1880 الخرطوم
T: (00249) 155 - 144913
T2: (00249) 18377171600- 2491
F: (00249) 183780 - 913
E: crpc@sabfs.edu.sd